Use the reports
Reports break the event down by day: orders, ticket sales, revenue, check-in and stands, plus a one-page wrap-up for after the event. Every figure is counted from your records as they stand now.
Open the reports
In the sidebar, under Insight, select Reports. The tabs are Registrations, Ticket sales, Revenue, Check-in, Exhibitors and Wrap-up.
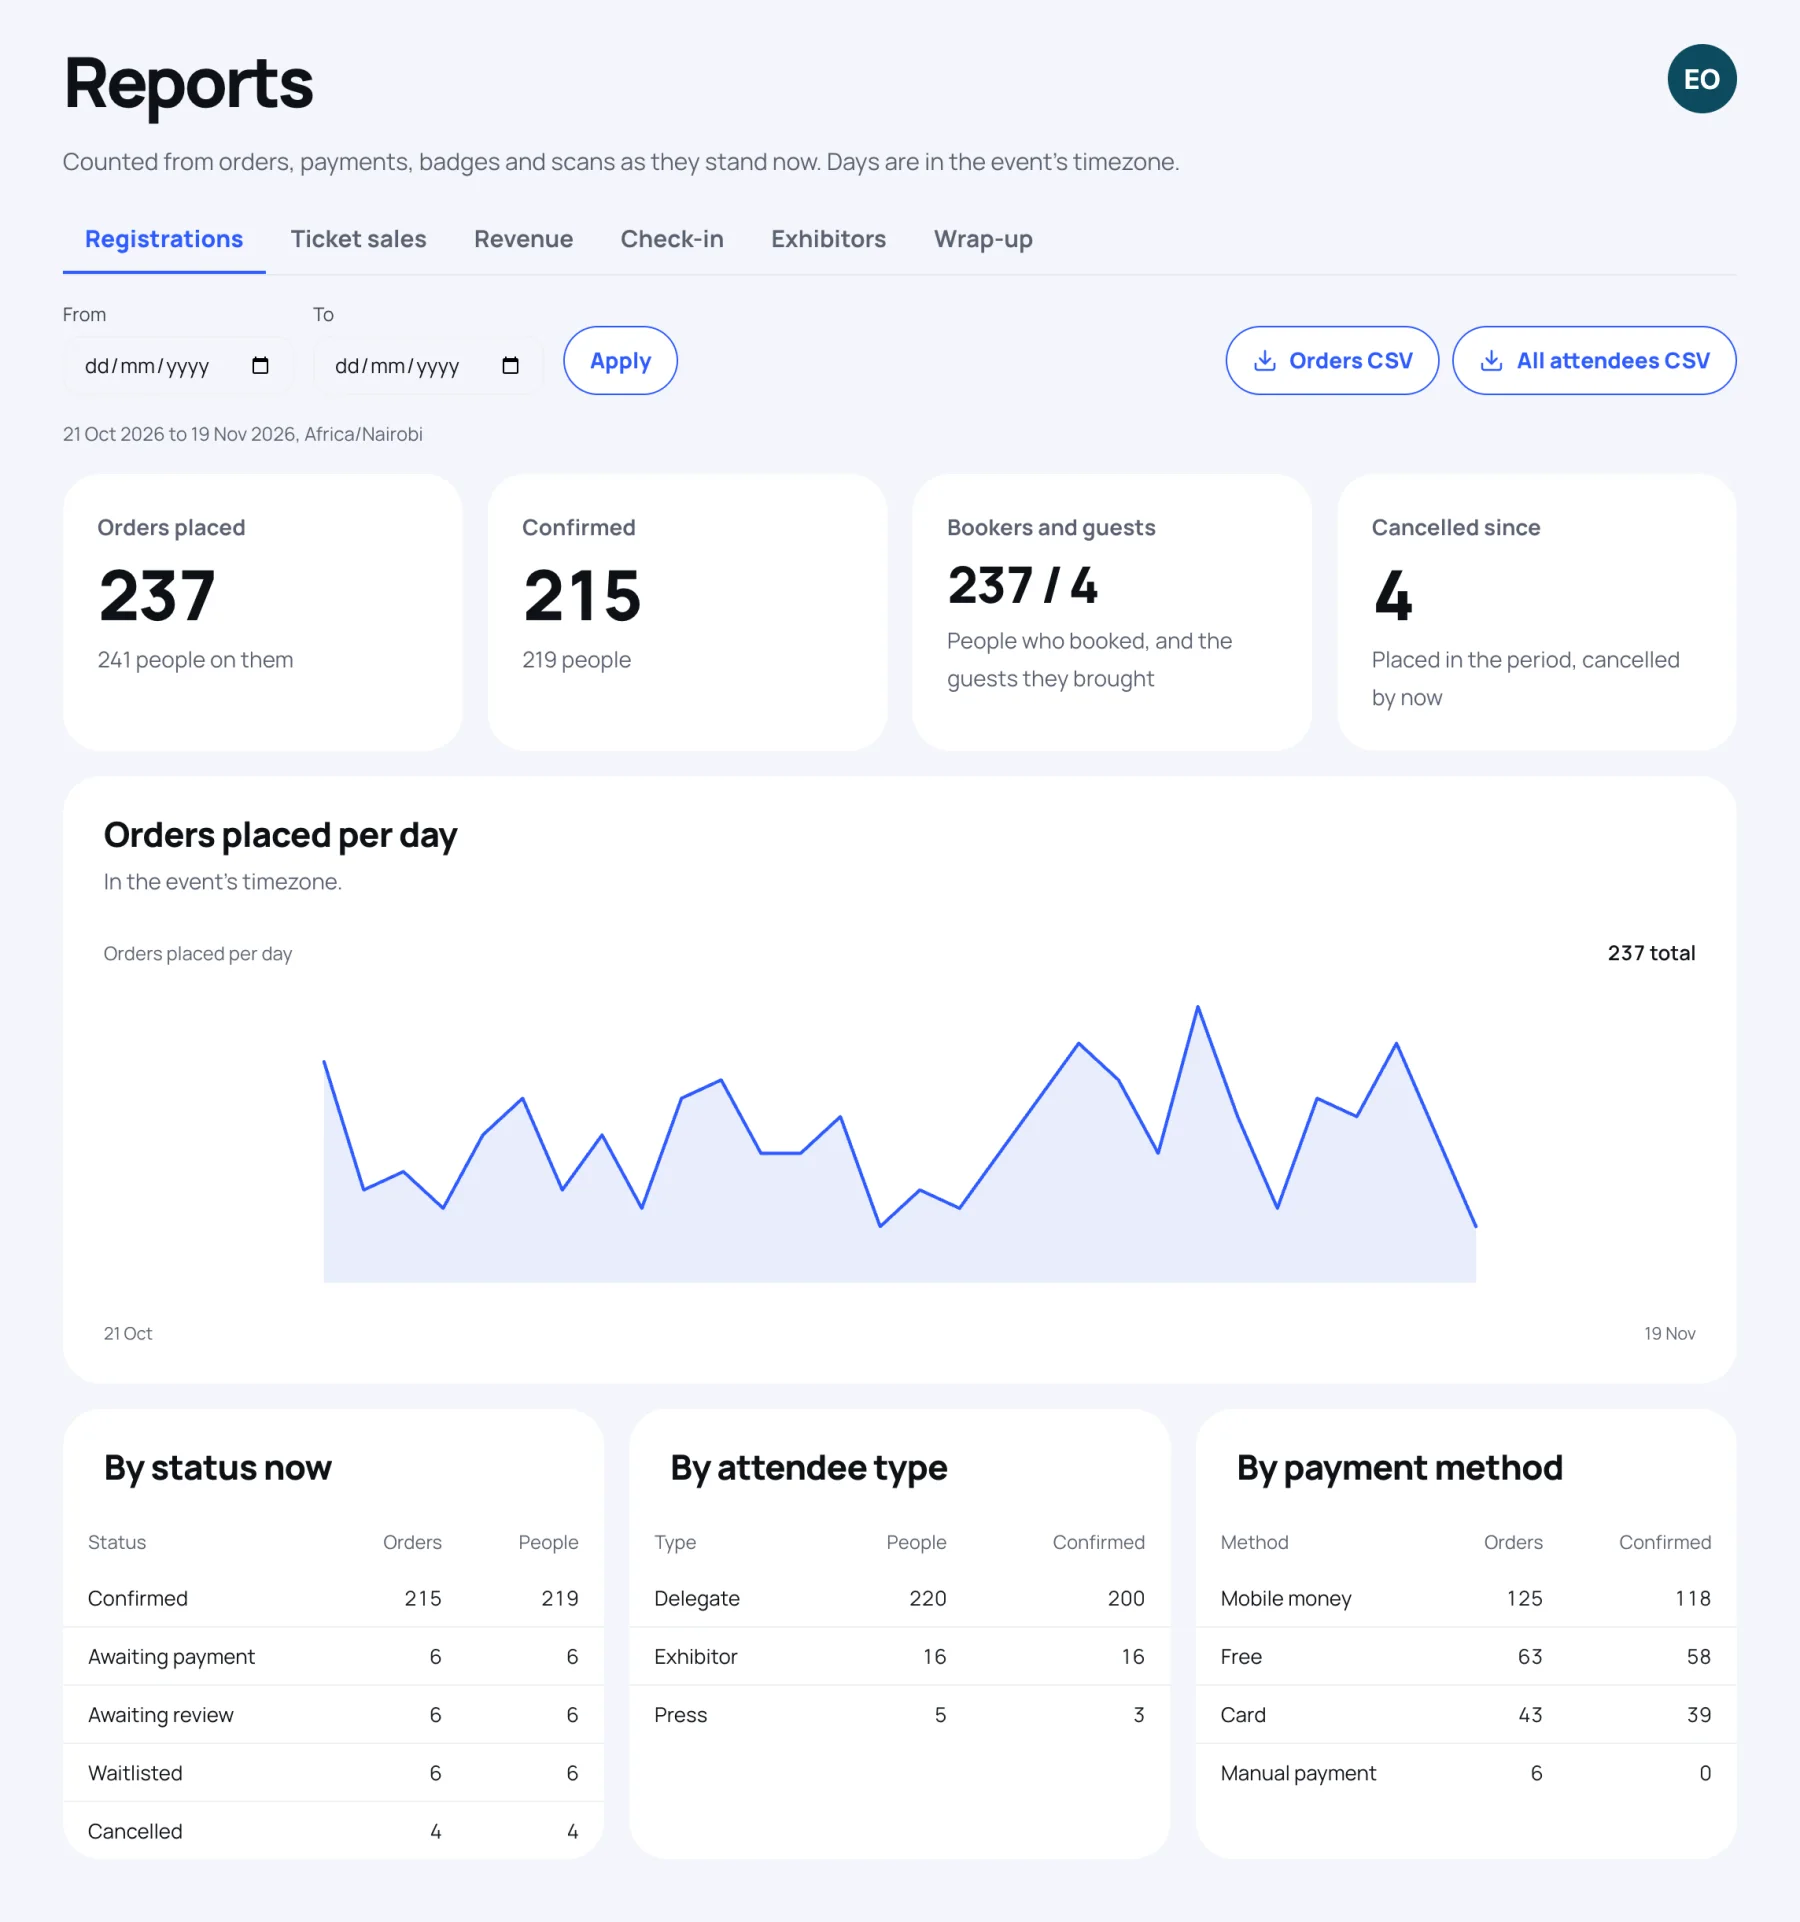
Choose the period
-
Pick a From and a To date.
-
Select Apply.

Without a period, a report covers the last 30 days up to today. Days are always in the event's time zone, and the line under the filter says which dates and zone the report used.
"In the period" means something slightly different on each tab:
| Report | Counts in the period |
|---|---|
| Registrations and Ticket sales | Orders placed in the period, counted by their status now |
| Revenue | Payments applied in the period, and refunds confirmed in the period |
| Check-in | Scans made in the period |
| Exhibitors | Booth views, bookmarks, leads and meetings recorded in the period |
What each report shows
| Tab | What you see |
|---|---|
| Registrations | Orders placed and the people on them, confirmed orders, bookers and the guests they brought, orders cancelled since, orders per day, and tables by status, attendee type and payment method |
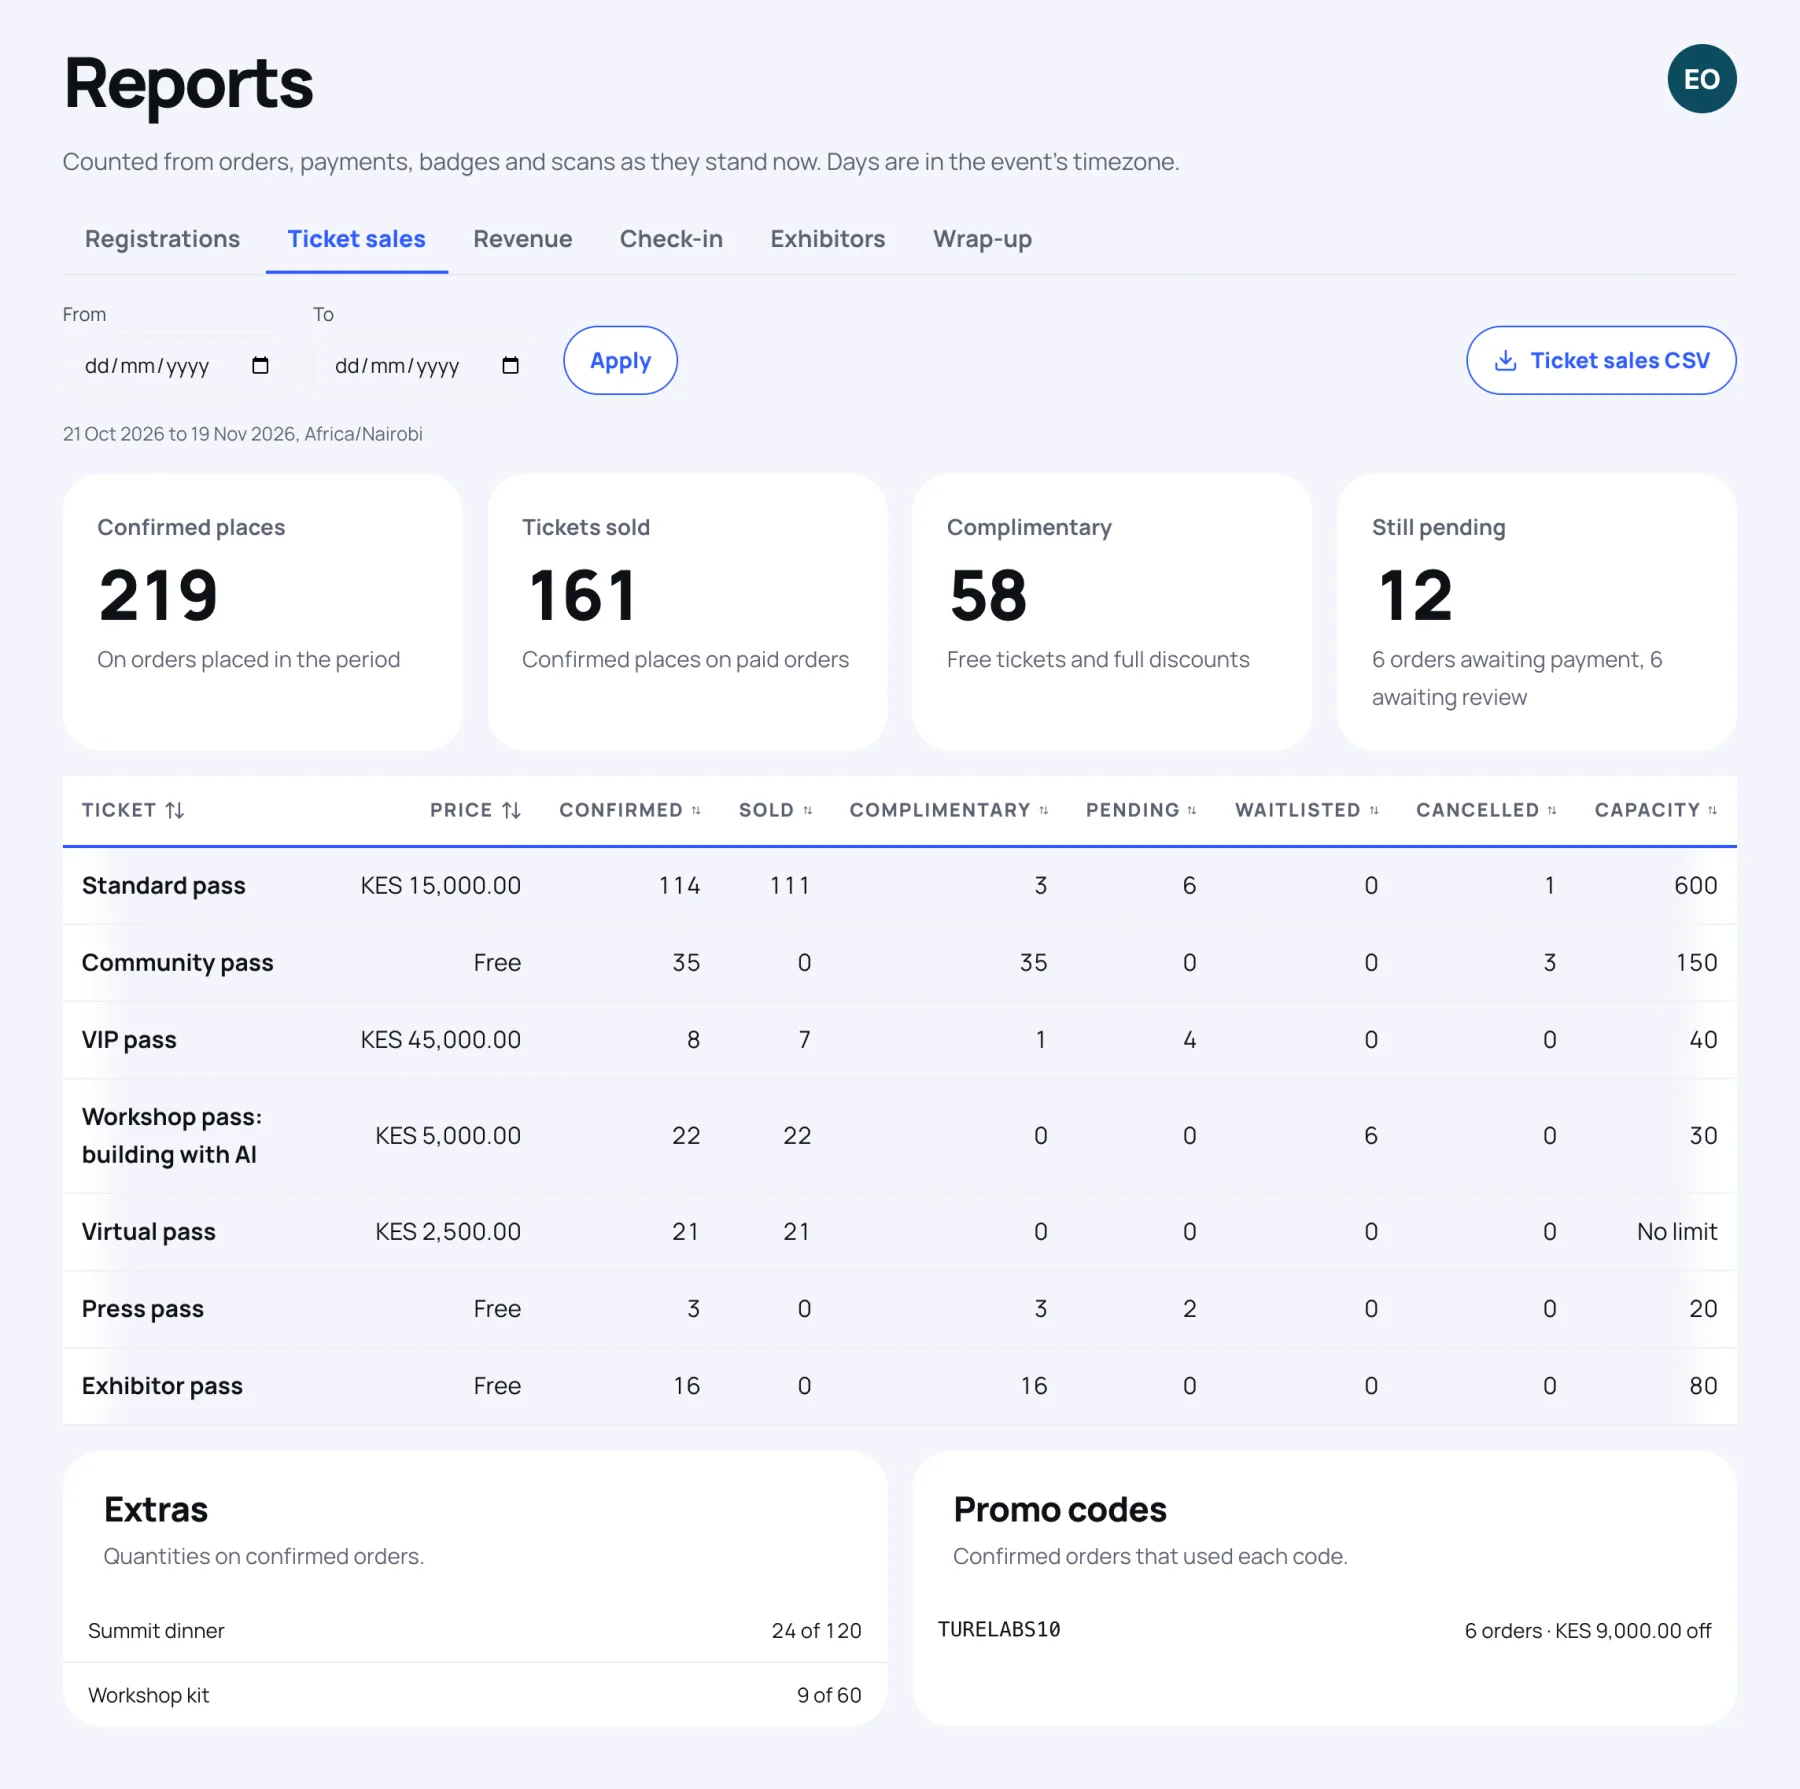
| Ticket sales | For each ticket: price, confirmed, sold, complimentary, pending, waitlisted, cancelled and capacity. Then extras sold and promo codes used |
| Revenue | Received, refunded, net and to return; received per day; by payment method; refunds by where they stand |
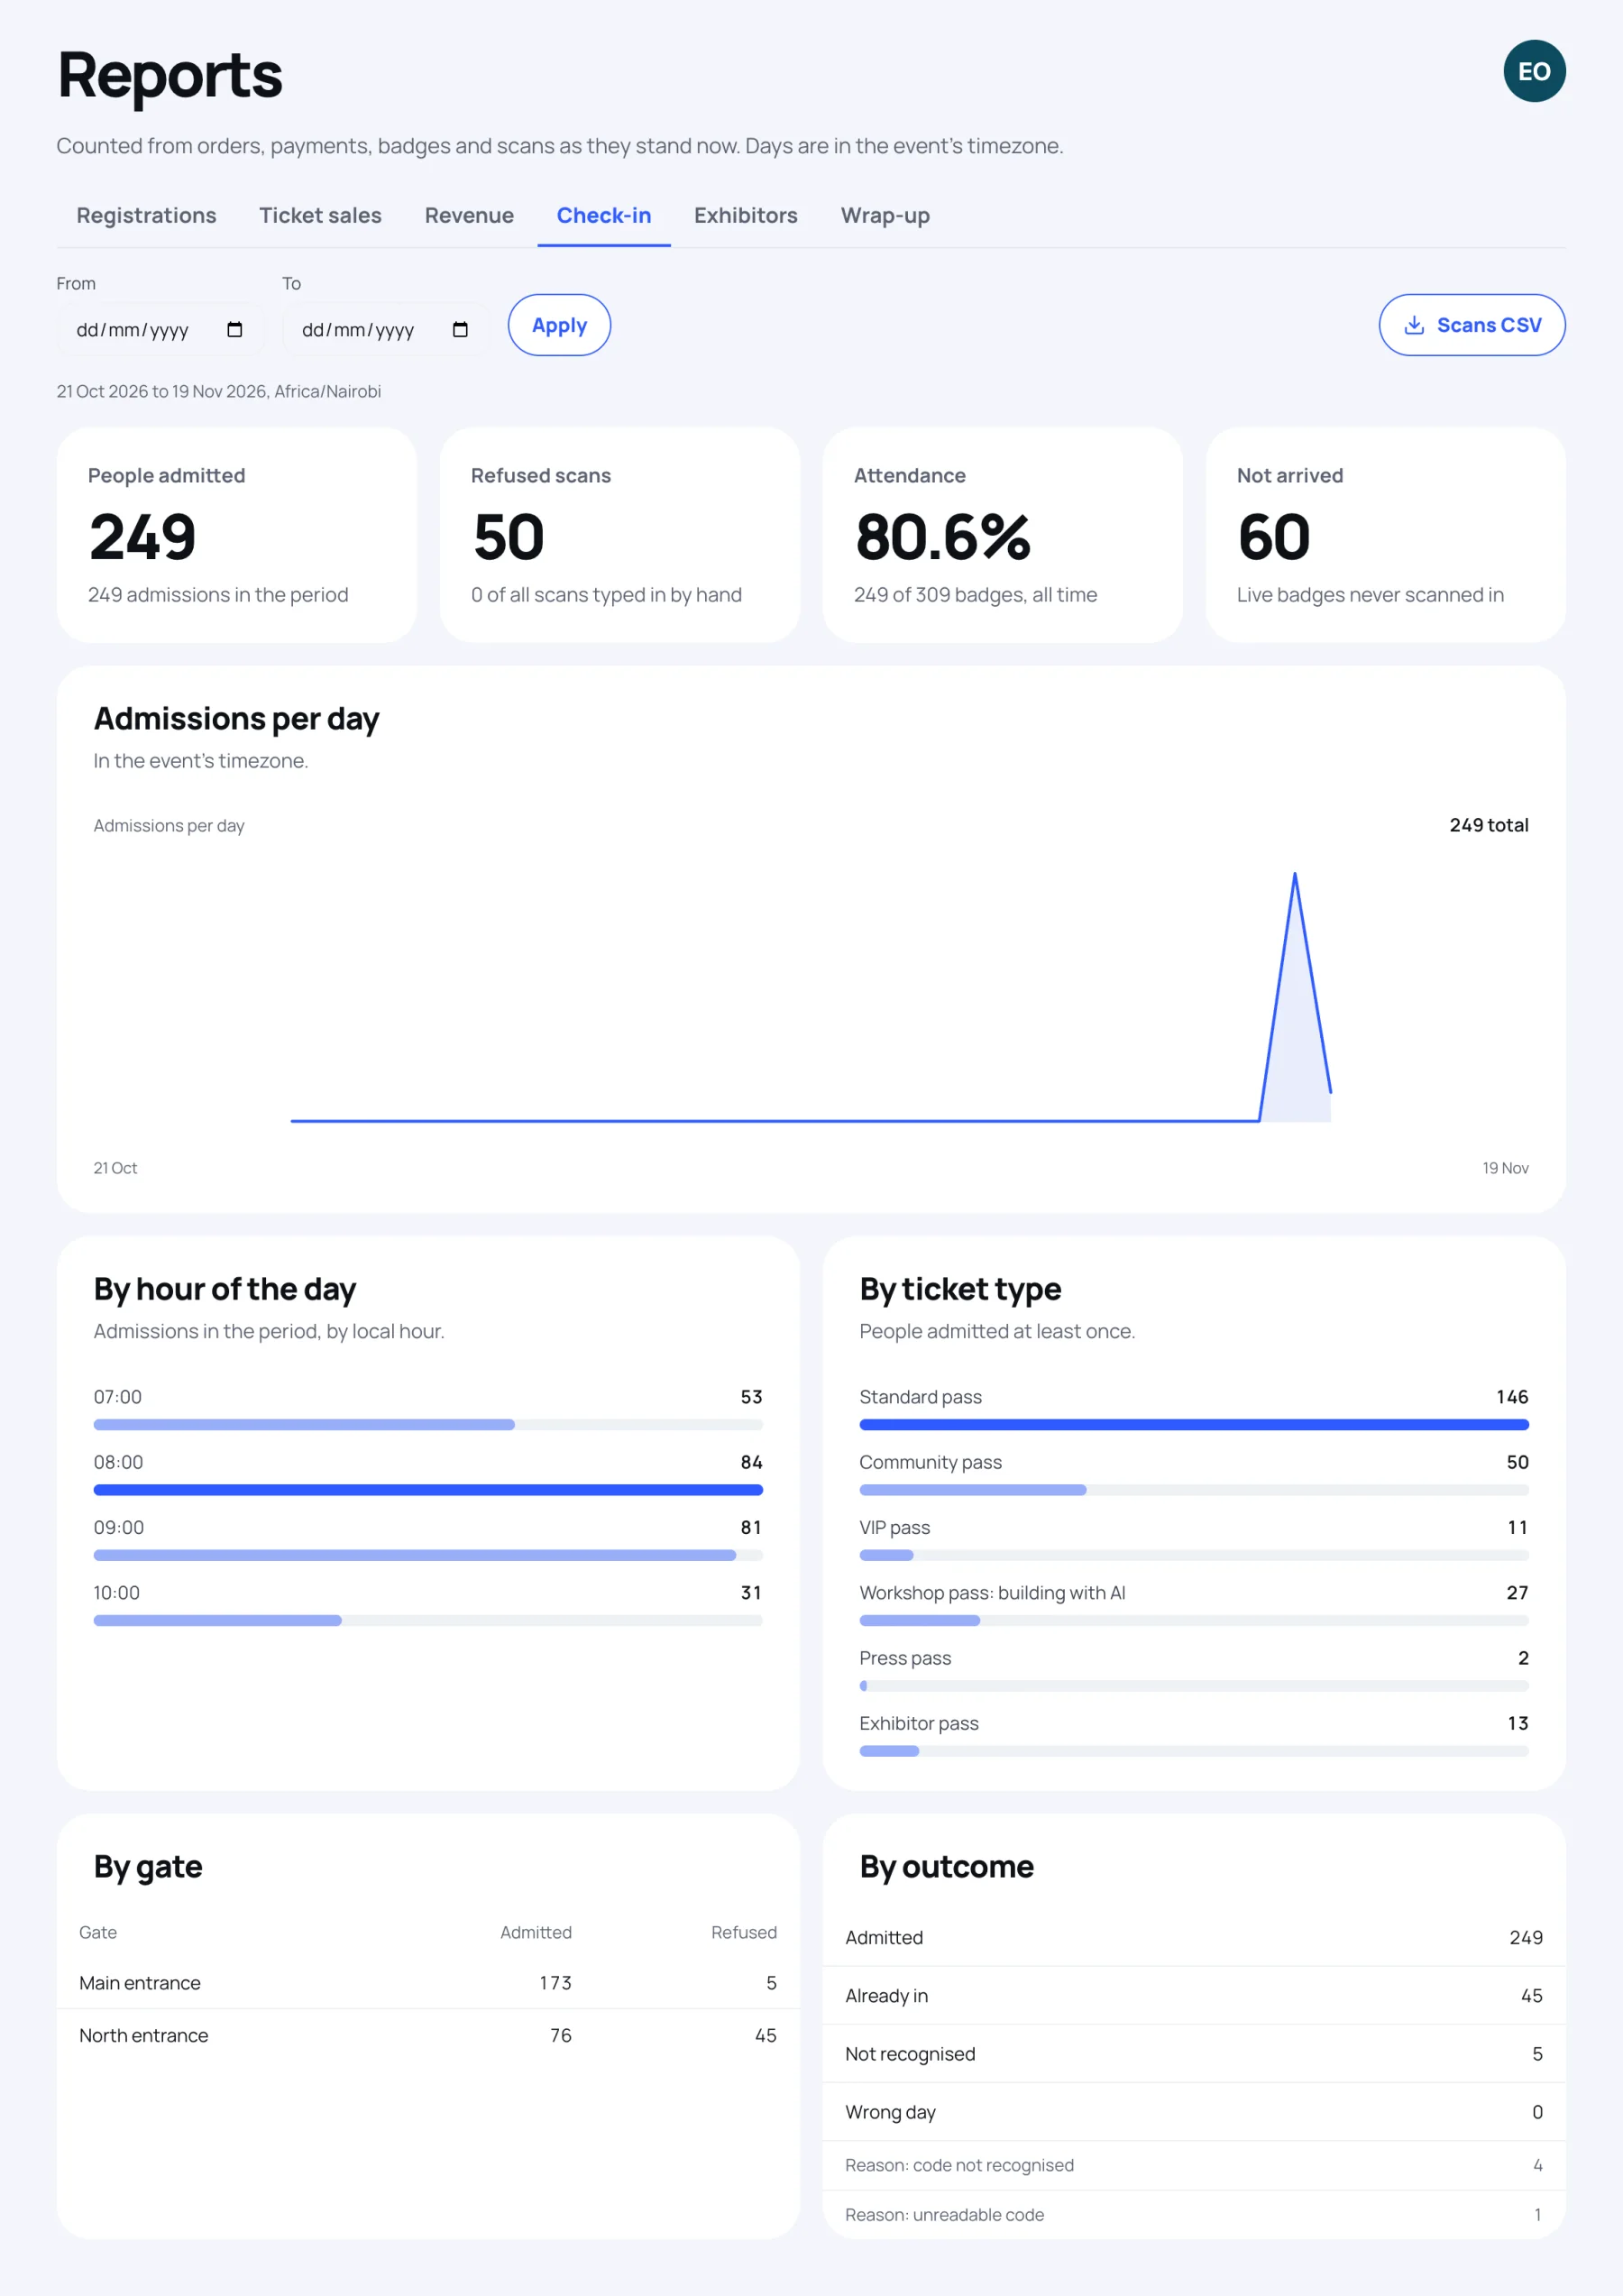
| Check-in | People admitted, refused scans, attendance and people not arrived; admissions per day and by hour; by ticket type, by gate and by outcome |
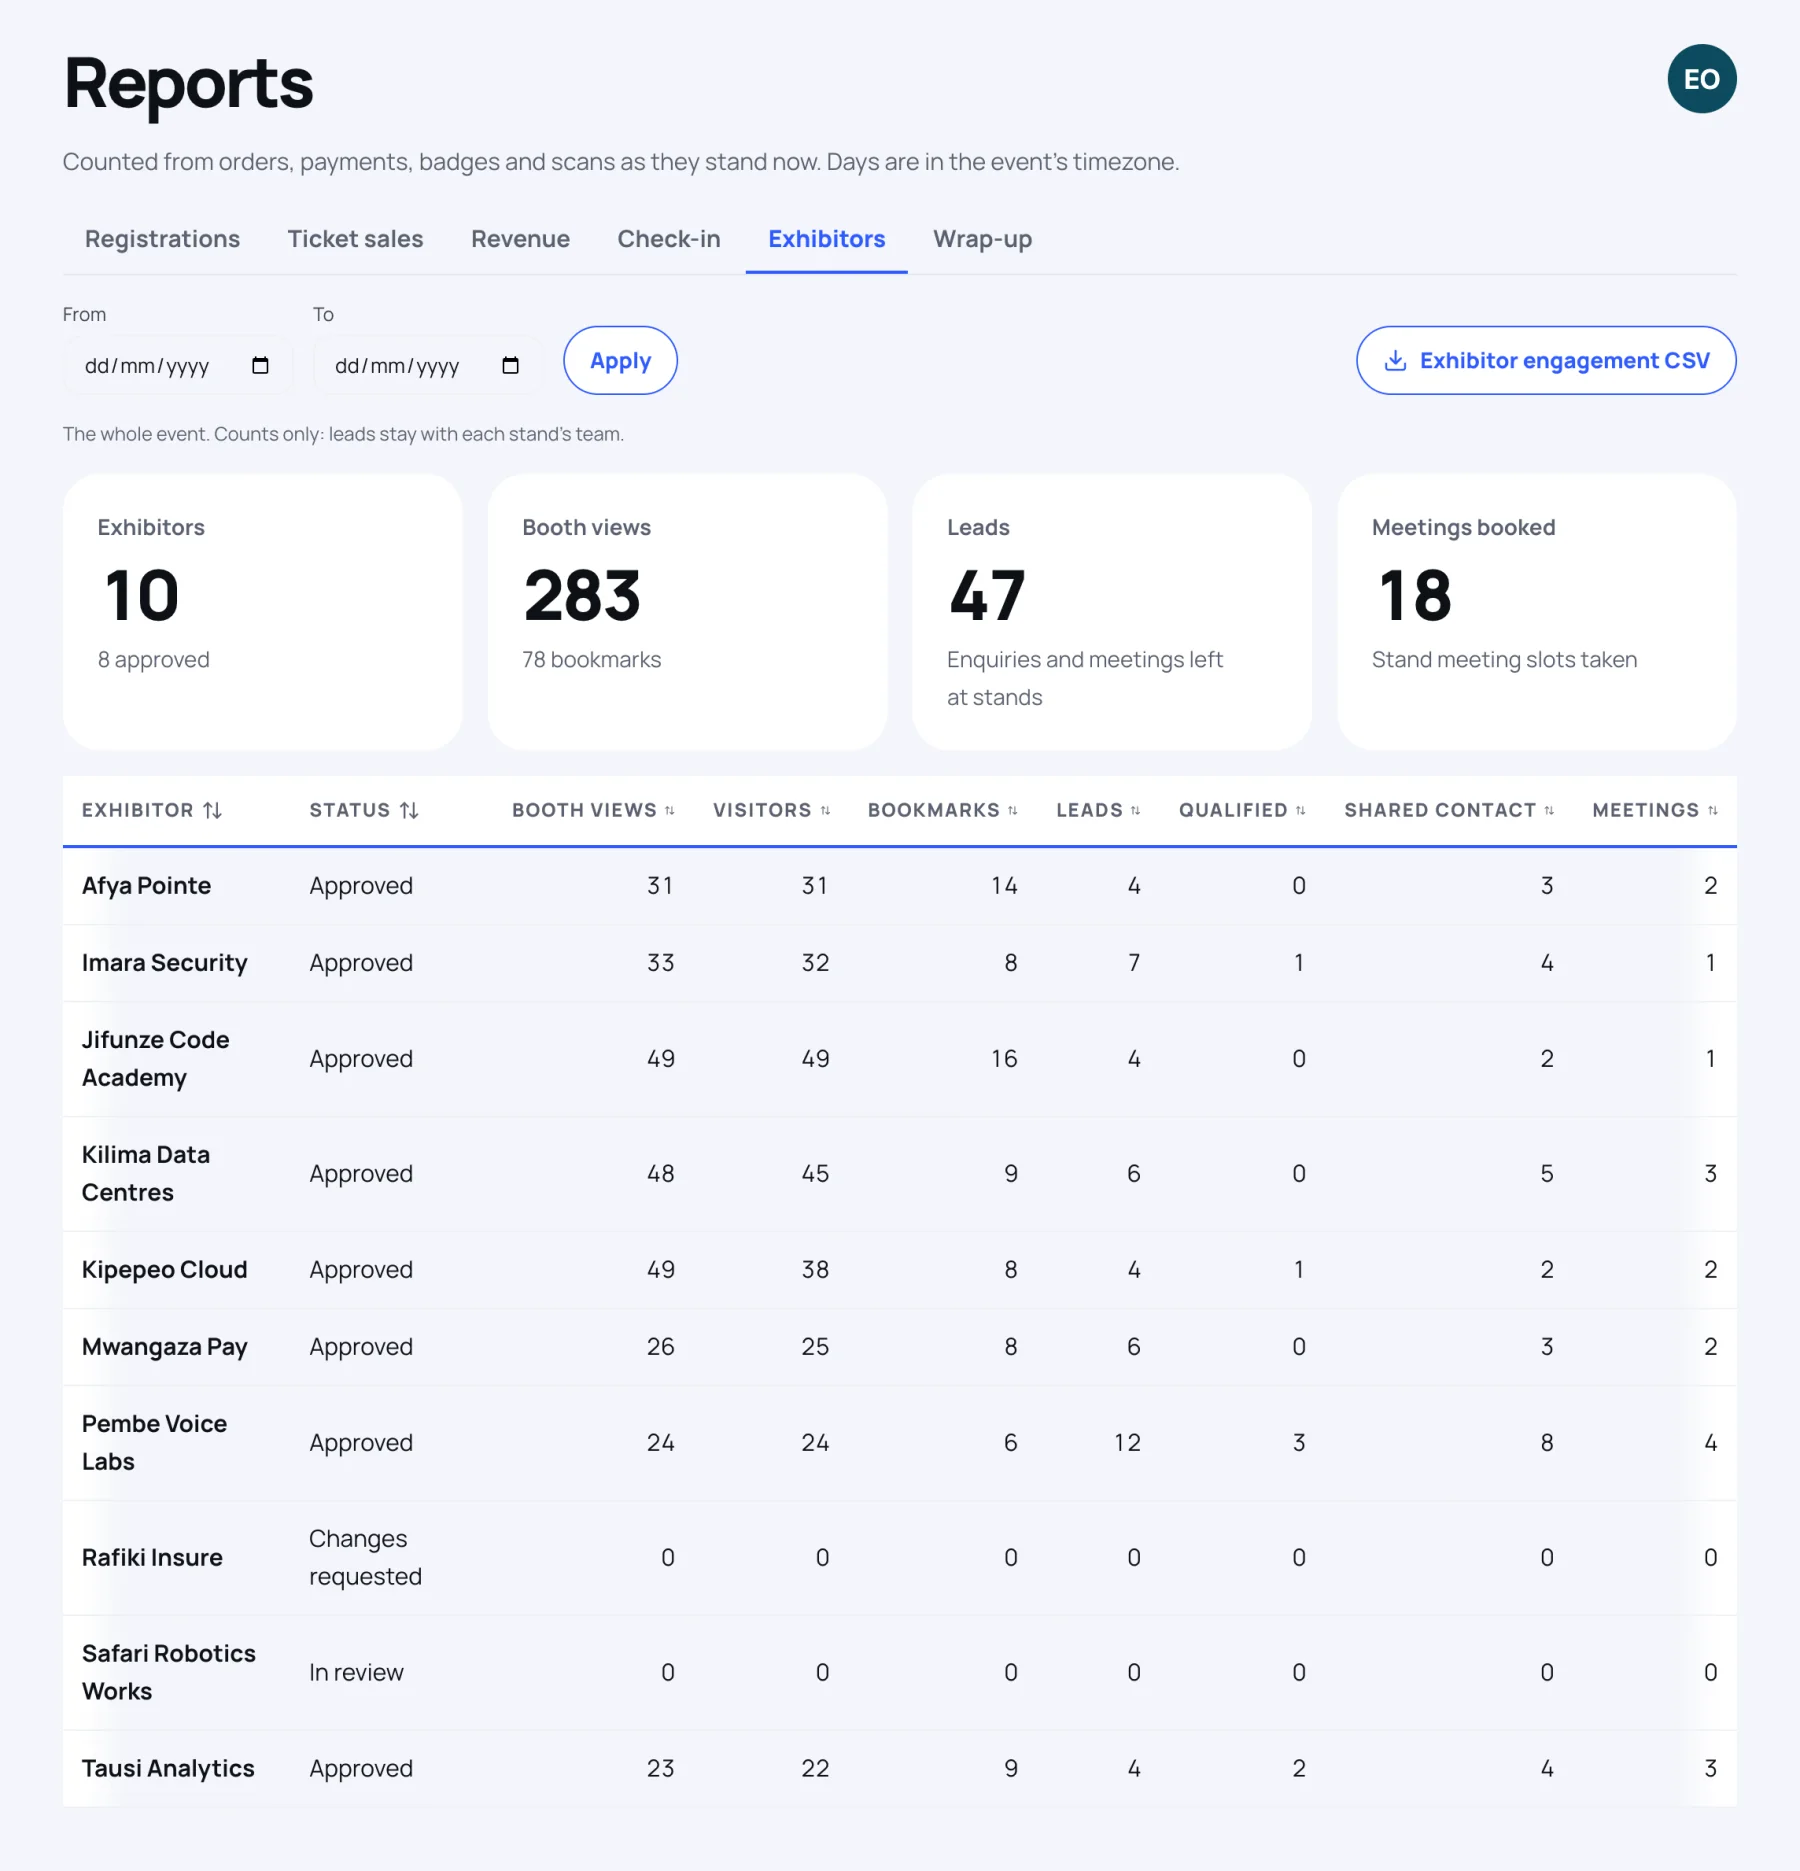
| Exhibitors | For each stand: booth views, visitors, bookmarks, leads, qualified leads, visitors who shared contact details, and meetings |
| Wrap-up | The whole event on one page: registrations, attendance, capacity used, net revenue, tickets, programme and exhibitors, and money |
Print the wrap-up
-
Select the Wrap-up tab. It always covers the whole event.
-
Select Print or save as PDF and use your browser's print window.
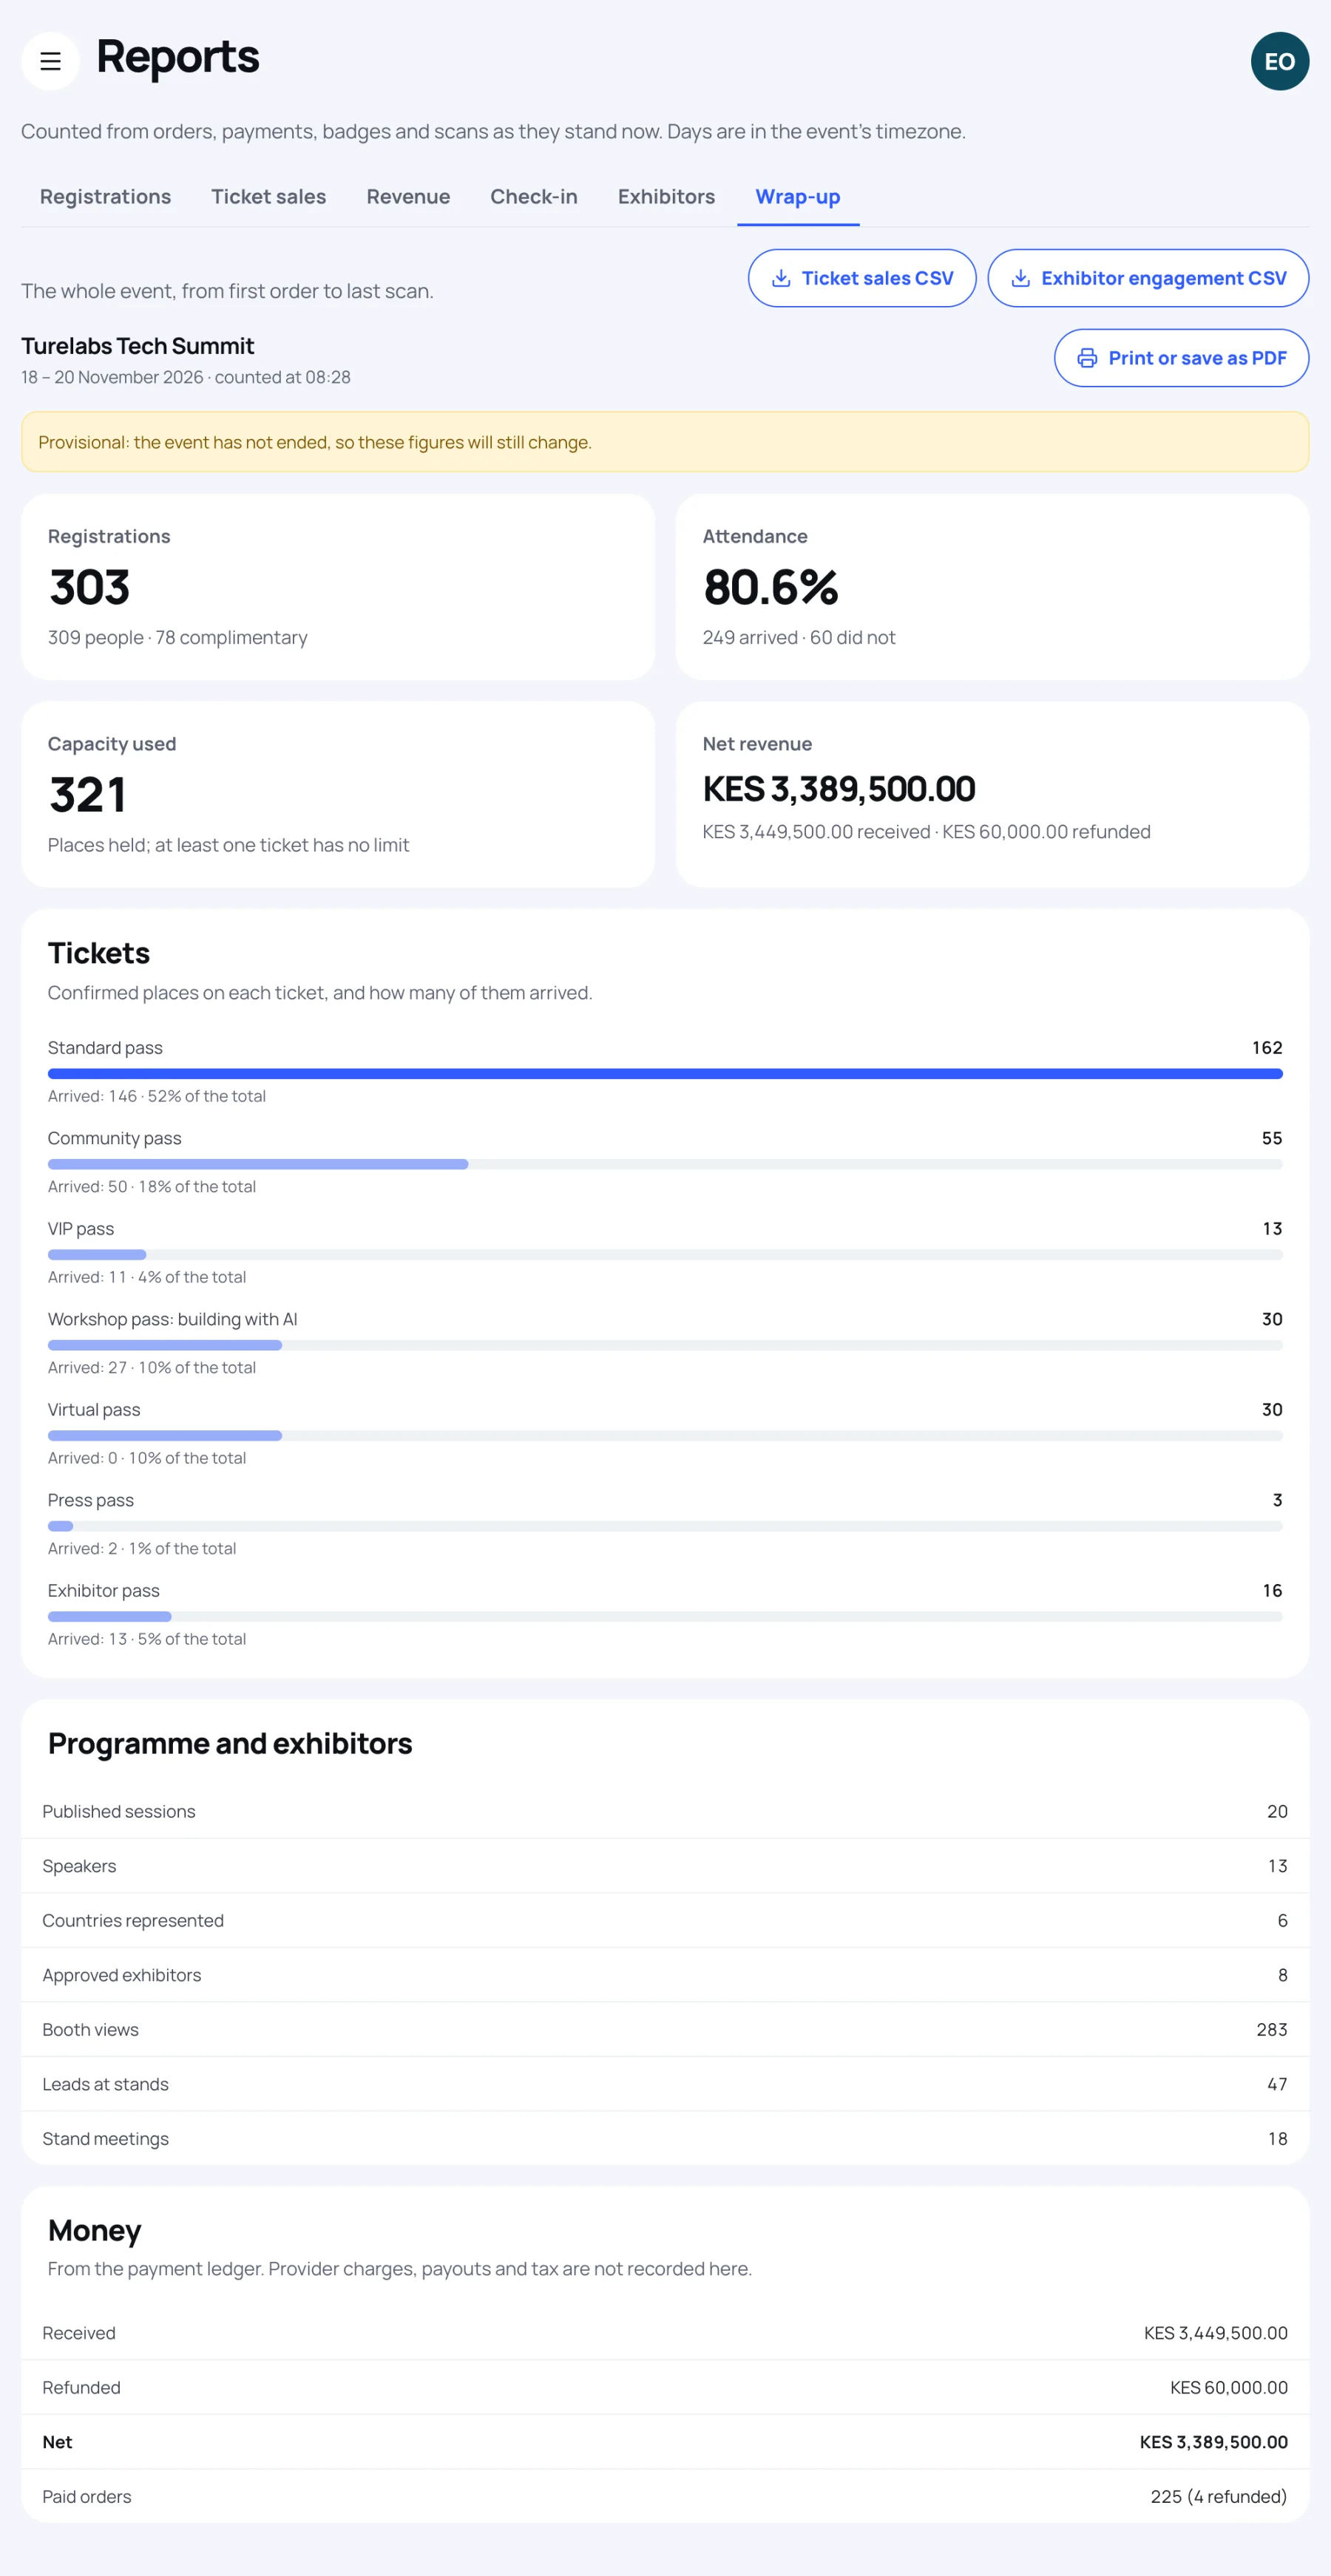
While the event is still running, the wrap-up is marked Provisional, because the figures will still change.
What reports do not include
Reports show only what Zufest records. They do not include provider fees, payouts, tax, page views or conversion rates.
Last updated